Arduino Serial Plotter: The Missing Manual
If you use Arduino, perhaps to handle the lower-level driving work of your DIY Robocar, you may have noticed the Serial Plotter tool, which is an easy way to graph data coming off your Arduino (much better than just watching numbers scroll past in the Serial Monitor).
You may have also noticed that the Arduino documentation gives no instructions on how to use it ¯\_(ツ)_/¯. You can Google around and find community tutorials, such as this one, which give you the basics. But none I’ve found are complete.
So this is an effort to make a complete guide to using the Arduino Serial Plotter, using some elements from the above linked tutorial.
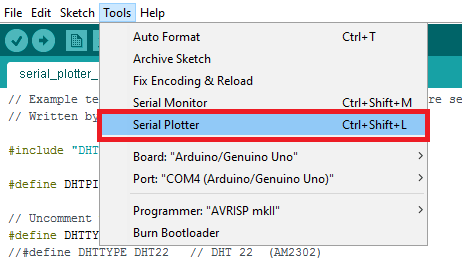
First, you can find the feature here in the Arduino IDE:
It will plot any data your Arduino is sending out in a Serial.print() or Serial.println() command. The vertical Y-axis auto adjusts itself as the value of the output increases or decreases and the X-axis is a fixed 500-point axis with each tick of the axis equal to an executed Serial.println() command. In other words the plot is updated along the X-axis every time Serial.println() is updated with a new value.
It also has some nice features:
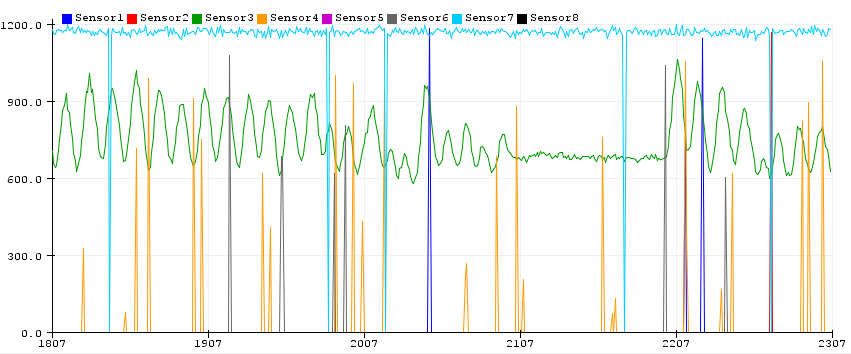
- Plotting of multiple variables, with different labels and colors for each
- Can plot both integers and floats
- Auto-resizes the scale (Y axis)
- Supports negative value graphs
- Auto-scrolls the X axis
But to make it work well, there are some tricks in how to format that data. Here’s a complete(?) list:
- Keep your serial speed low. 9600 is the best for readability. Anything faster than 57600 won’t work.
- Plot one variable: Just use Serial.println()
Serial.println(variable);
- Plot more than one variable. Print a comma between variables using Serial.print() and use a Serial.println() for the variable at the end of the list. Each plot will have a different color.
Serial.print(variable1);
Serial.print(",");
Serial.print(variable2);
Serial.print(",");
Serial.println(last_variable); // Use Serial.println() for the last one
- Plot more than one variable with different labels. The labels will be at the top, in colors matching the relevant lines. Use Serial.print() for each label. You must use a colon (and no space) after the label:
Serial.print("Sensor1:");
Serial.print(variable1);
Serial.print(",");
Serial.print("Sensor2:");
Serial.print(variable2);
Serial.print(",");
Serial.println(last_variable); // Use Serial.println() for the last one
A more efficient way to do that is to send the labels just once, to set up the plot, and then after that you can just send the data:
void setup() {
   // initialize serial communication at 9600 bits per second:
   Serial.begin(9600);
   Serial.println("var1:,var2:,var3:");
 }
void loop() {
   // read the input on analog pin 0:
   int sensorValue1 = analogRead(A1);
   int sensorValue2 = analogRead(A2);
   int sensorValue3 = analogRead(A3);
   // print out the value you read:
   Serial.print(sensorValue1);
   Serial.print(",");
   Serial.print(sensorValue2);
   Serial.print(",");
   Serial.println(sensorValue3);
   delay(1);        // delay in between reads for stability
 }
- Add a ‘min’ and ‘max’ line so that you can stop the plotter from auto scaling (Thanks to Stephen in the comments for this):
Serial.println("Min:0,Max:1023");- Or if you have multiple variables to plot, and want to give them their own space:
Serial.print("Min:0,");
Serial.print("Sensor1:");
Serial.print(map(variable1,0,1023,0,100));
Serial.print(",");
Serial.print("Sensor2:");
Serial.print(map(variable2,0,1023,100,200));
Serial.print(",");
Serial.print("Sensor3:");
Serial.print(map(variable3,0,1023,200,300));
Serial.print(",");
Serial.println("Max:300");
Of course, now the numbers on the y-axis don’t mean much, but you can still see the waveforms.