Review of the new HuskyLens AI camera as a robocar brain
There are so many cool sensors and embedded processors coming out of China these days! The latest is the amazing HuskyLens, which is a combination of a powerful AI/computer vision processor, a camera and a screen — for just $45. HuskyLens comes with a host of CV/AI functions pre-programmed and a simple interface of a scroll wheel and a button to choose between them and change their parameters.
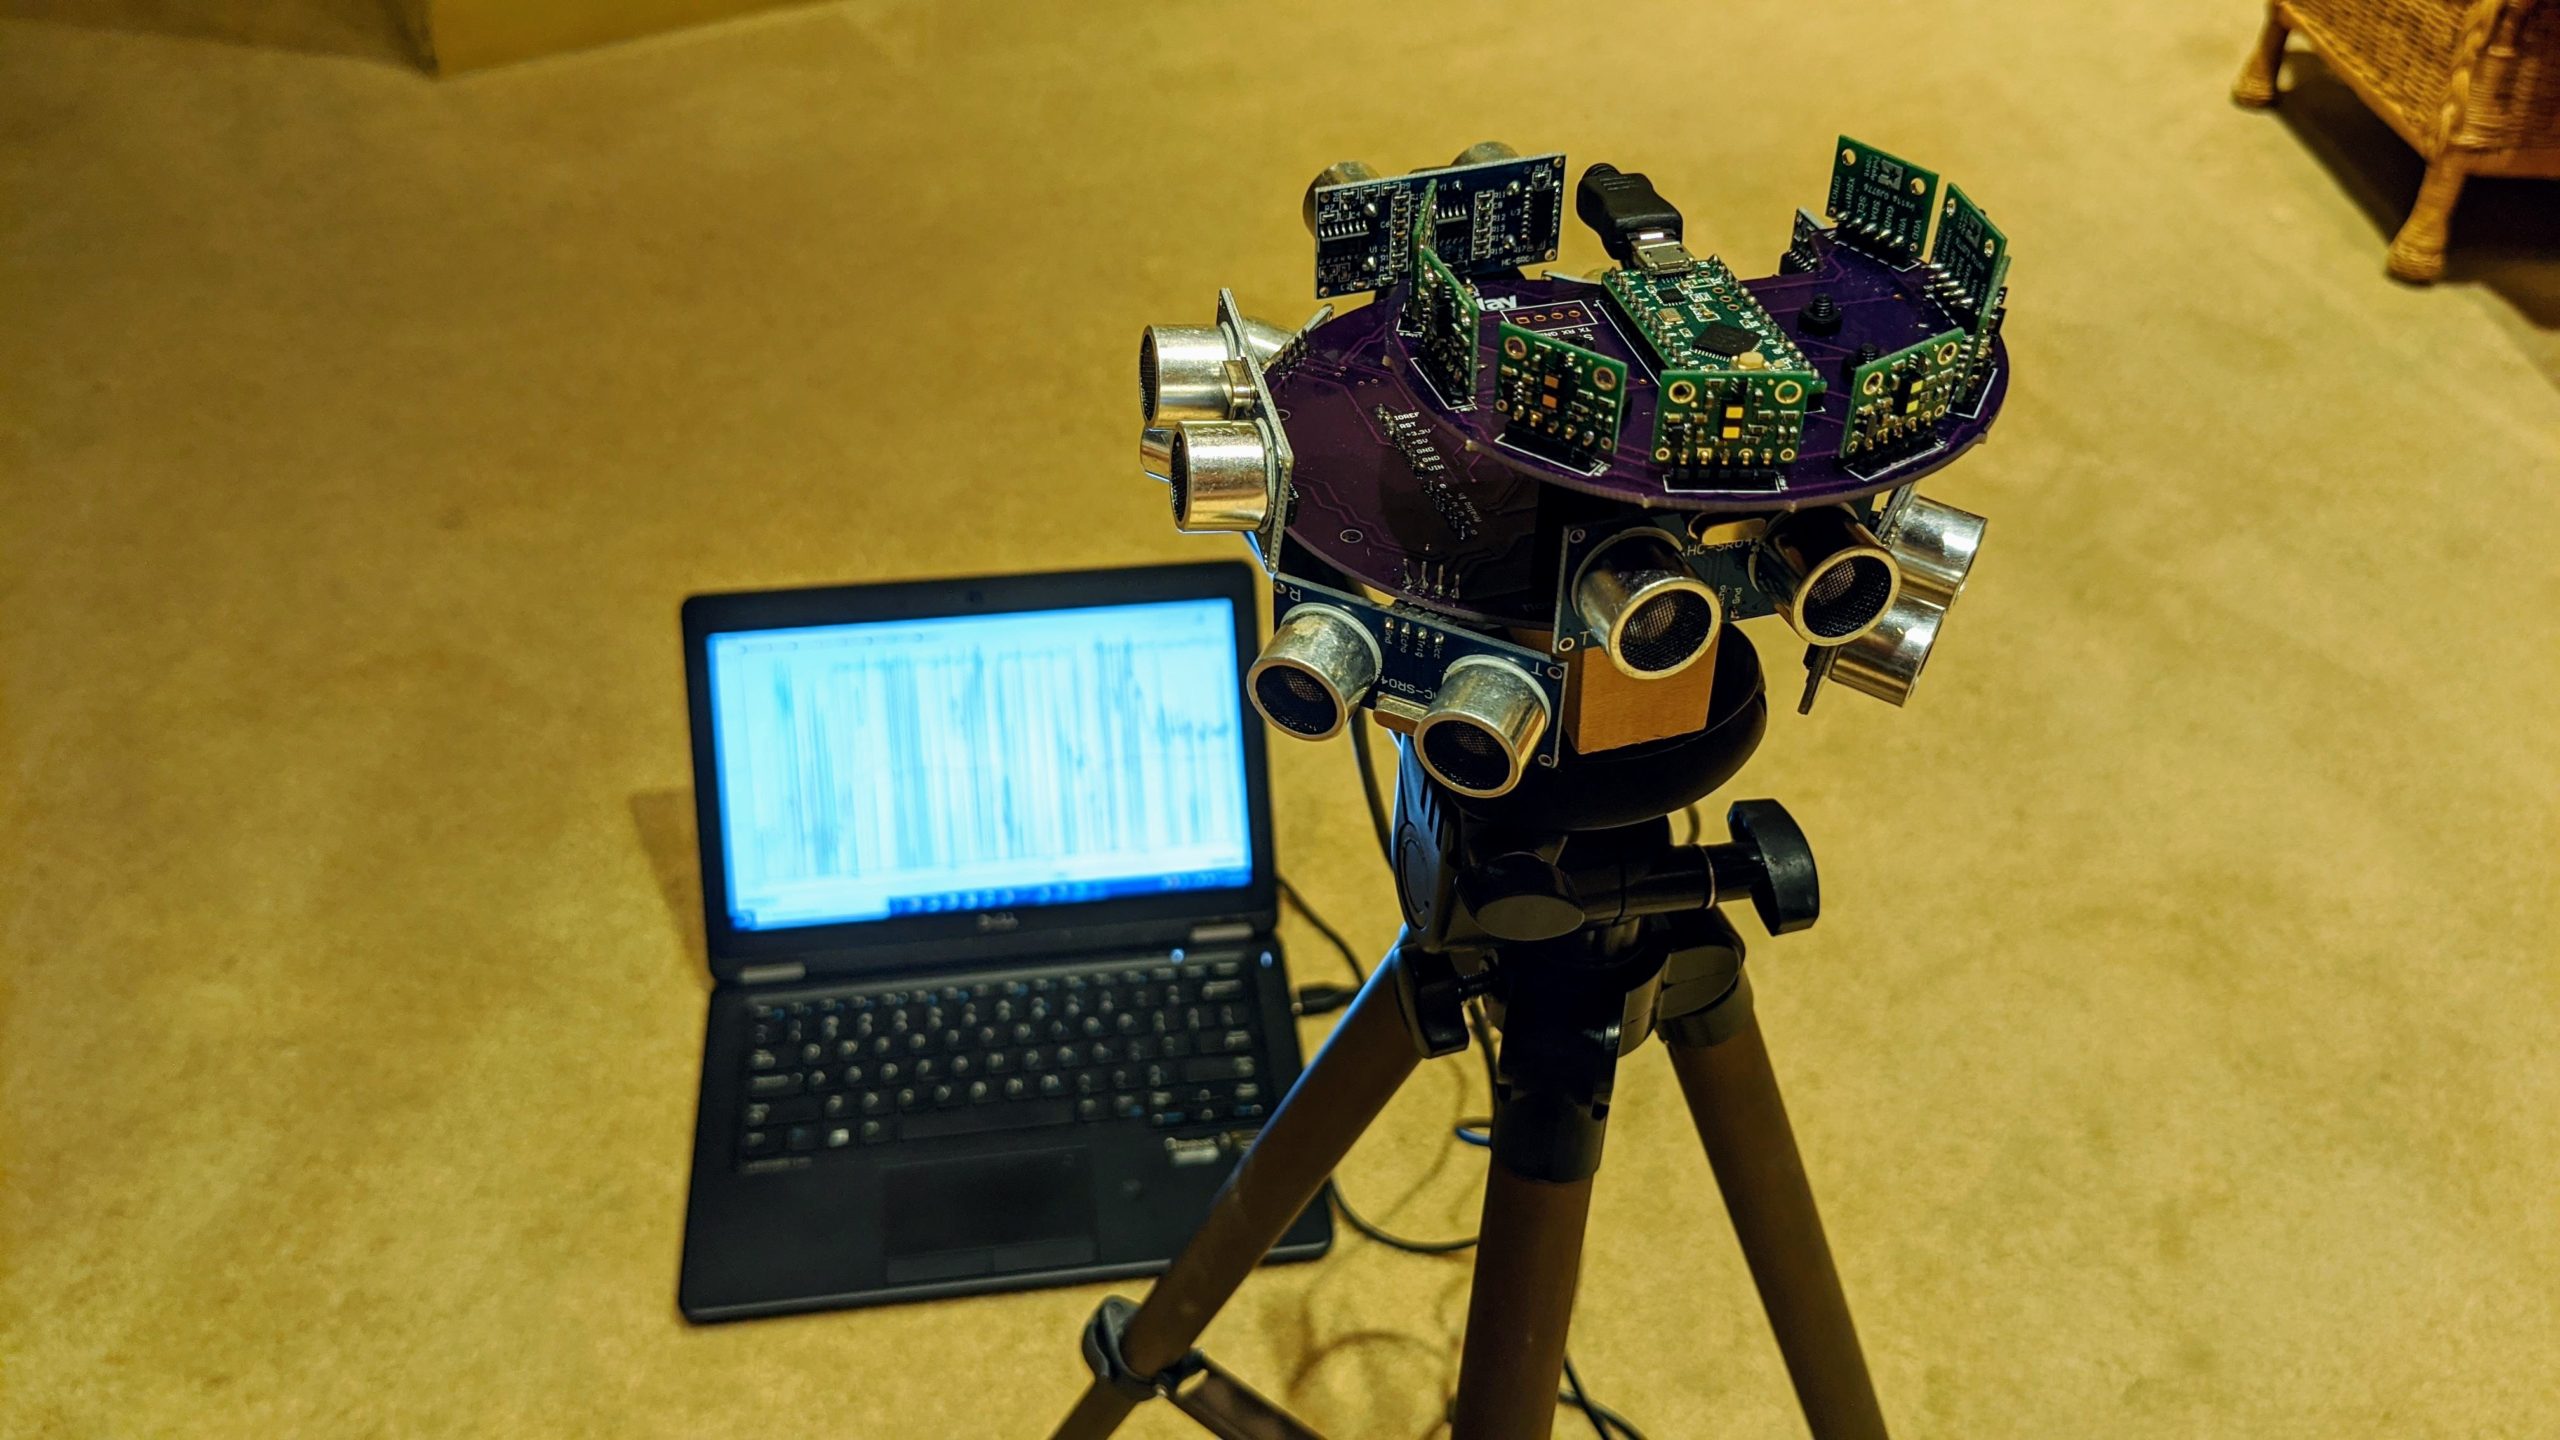
To test its suitability for DIY Robocars, I swapped it in on my regular test car, replacing an OpenMV camera. I used the same Teensy-based board I designed for the OpenMV to interface with a RC controller and the car’s motor controller and steering servo. But because the HuskyLens can’t be directly programmed (you’re limited to the built-in CV/AI functions) I used it just for the line-following function and programmed the rest of the car behavior (PID steering, etc) on the Teensy. You can find my code here.
As you can see from the video above, it works great for line following.
Advantages of the HuskyLens include:
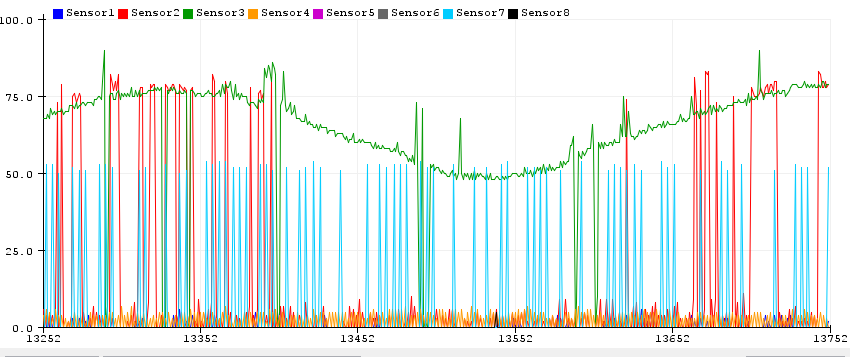
- It’s super fast. I’m getting 300+ FPS for line detection. That’s 5-10x the speed of OpenMV (but with some limitations as discussed below)
- Very easy to interface with an Arduino or Teensy. The HuskyLens comes with a cable that you can plug into the Arduino/Teensy and an Arduino library to make it easy to read the data.
- The built-in screen is terrific, not only as a UI but to get real-time feedback on how the camera is handling a scene without having to plug it into a PC.
- Easy to adjust for different lighting and line colors
- Built-in neural network AI programs that make it easy to do object detection, color detection, tags, faces and gestures. Just look at what you want to track and press the button.
Compared to the OpenMV, some disadvantages of HuskyCam include:
- You can’t change the camera or lens. So no fisheye lens option to give it a wider angle of view
- You can’t directly program it. So no fancy tricks like perspective correction and tracking two different line colors at the same time
- You’ll have to pair it with an Arduino or Teensy to do any proper work like reading RC or driving servos (OpenMV, in contrast, has add-on boards that do those things directly)
- It consumes about twice the power of OpenMV (240ma) so you may need a beefier power supply than simple the BEC output from your car’s speed controller. To avoid brownouts, I decided not to use the car’s regular motor controller’s output to power the system and used a cheap switching power supply instead.
If you want to do a similar experiment, here are some tips on my setup:
Hardware:
- I used a cheap ($39) chassis from Seeed Studio.
- You’ll also need a motor controller and battery and, if you also want RC control, a RC transmitter and receiver)
- You can 3D print my camera mount or order it to be printed for you at Shapeways here.
- A Teensy LC is plenty fast enough to run the code
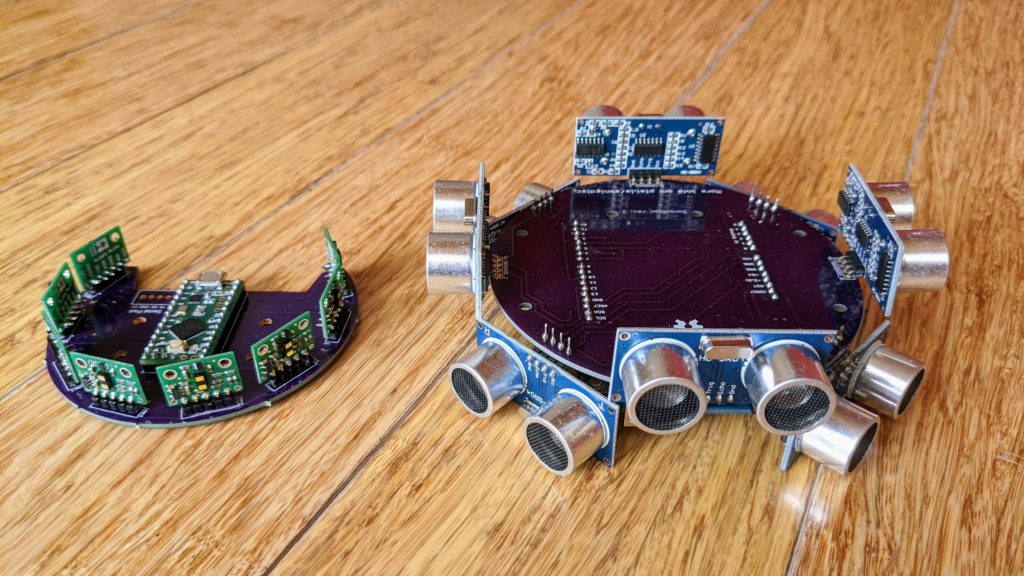
- You can order my Teensy RC PCB, to make the connections easier, from OSHPark here. It also works with OpenMV.
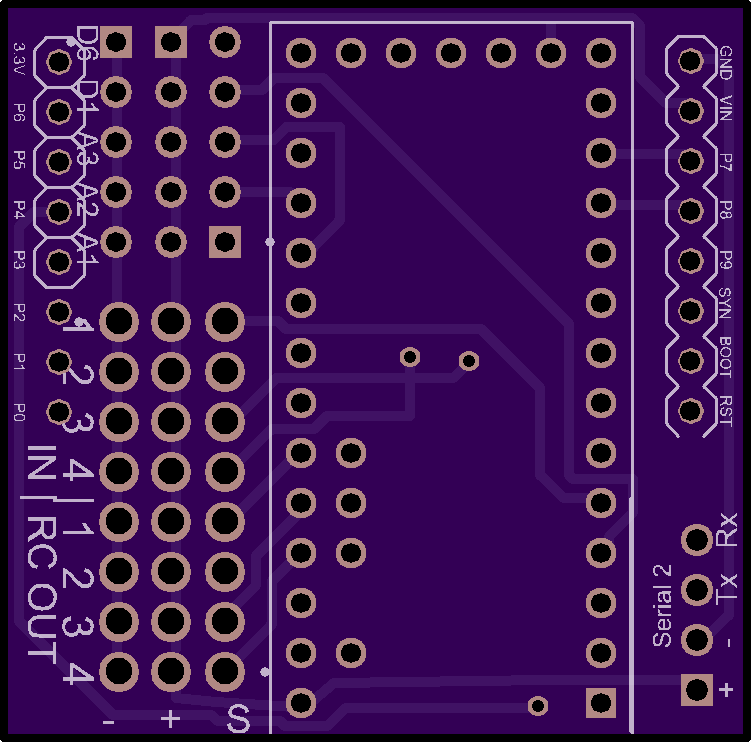
After you solder in the Teensy with header pins, solder in a 3-pin header for RC IN 1,2,3 and RC OUT 1 and 2. You’ll connect your RC receiver’s channels 1 and 2 to RC IN 1 and 2 and whichever channel you want to use to switch from RC to auto modes to RC IN 3. Connect the steering servo to RC Out 1 and the motor controller to RC Out 2. If you’re using a separate power supply, you can plug that into any spare RC in or out pins
Also solder a 4-pin connect to Serial 2. Your HuskyLens will plug into that. Connect the HuskyLens “T” wire to the Rx and “R” wire to the Tx, and + and – to the corresponding pins.
Software:
- My code should pretty much work out of the box on a Teensy with the above PCB. You’ll need to add the HuskyLens library and the AutoPID library to your Arduino IDE before compiling.
- It assume that you’re using a RC controller and you have a channel assigned (plugged into RC IN 3) for selecting between RC and HuskyLens controlled modes. If you don’t want to use a RC controller, set
boolean Use_RC = true;to false - It does a kinda cool thing of blending the slope of the line with its left-right offset from center. Both require the car to turn to get back on line.
- If you’re using RC, the throttle is controlled manually with RC in both RC and auto modes. If not, you can change it by modifying this line:
const int cruise_speed = 1600;. 1500 is stopped; less than that is backwards and more than that (up to 2000) is forwards at the speed you select. - It uses a PID controller. Feel free to change the settings, which are KP, KI and KD, if you’d like to tune it
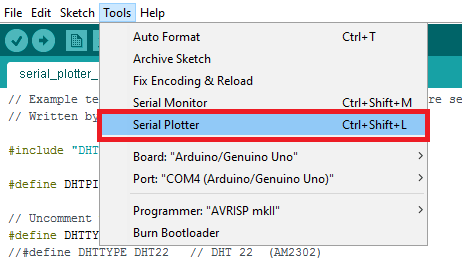
- On your HuskyLens, use the scroll wheel to get to General Settings and change the Protocol/Serial Baud Rate to 115200.